Plate-solving is a technique used by astrophotographers to align the telescope in the sky very precisely using a star pattern matching algorithm. Aligning the telescope via plate-solving is not only easier but also significantly more accurate than any manual alignment. Astrophotographers save time on the 1, 2, or 3-star alignment process of the mount – just point the telescope somewhere in the sky, take a picture, plate-solve, synchronize the mount, and off you go. In this post, we will look at the plate-solving process itself – how does the software recognize a section of the sky and calculate celestial coordinates of the center of the image?
Blind and local plate solvers
There are two categories of plate-solver programs – blind plate solvers and local ones.
- Blind plate solvers, like Astrometry.net or All Sky Plate Solver, take completely arbitrary pictures of the night sky and resolve them without any additional hints about their approximate location. They usually take more time and are more compute-intensive.
- Local plate-solvers, like ASTAP or PlaneWave Solve2, require a hint about approximate location in the sky and telescope field of view to work. They are quicker, have smaller star databases and consume less CPU.
Even though these programs do seemingly similar jobs, their star matching algorithms are different. Blind plate-solvers maintain a global inverse index of an entire night sky. They extract star signatures (hashes) from the image and search that index for matches. Here’s the whitepaper on Astometry.net for those interested in more details. We will not be covering blind plate solvers in this post.
This post is about local plate-solvers. We will look at how they extract stars from the image and scan the catalog of stars looking for matches. Here’s how ASTAP describes its algorithm.
Disclaimer
This article doesn’t describe the implementation of any particular plate-solver. Frankly, I do not know what they do exactly. I took the white paters and public documentation of existing plate-solvers and implemented my own program. It worked remarkably well. Since my plate solver works, I expect other plate-solvers to follow similar principles in their implementation. If you’ve come here to learn what PlaneWave Solve2 does under the hood – I am sorry to disappoint you.
Step 1: Image histograms
The first thing that any plate-solver must do is find stars on the image. However, how do you find stars programmatically? As humans, our brains recognize stars immediately because they run fairly complex neural networks. However, plate solvers aren’t sporting neural networks and instead rely on discrete algorithms to find stars. Those algorithms can analyze one pixel at a time, so how can we tell if we are looking at the pixel of the star, or a pixel of the nebula under the star? Color histograms to the rescue!
The color histogram represents the distribution of color in the image. We are going to be looking at color images, which are made of 3 channels – Red, Green, and Blue. Each color channel has a value between 0 and 255. To build a color histogram we need to count how many pixels of every single color value there are in the image. Horizontal axis – color channel value, Vertical axis – number of pixels of corresponding color value.
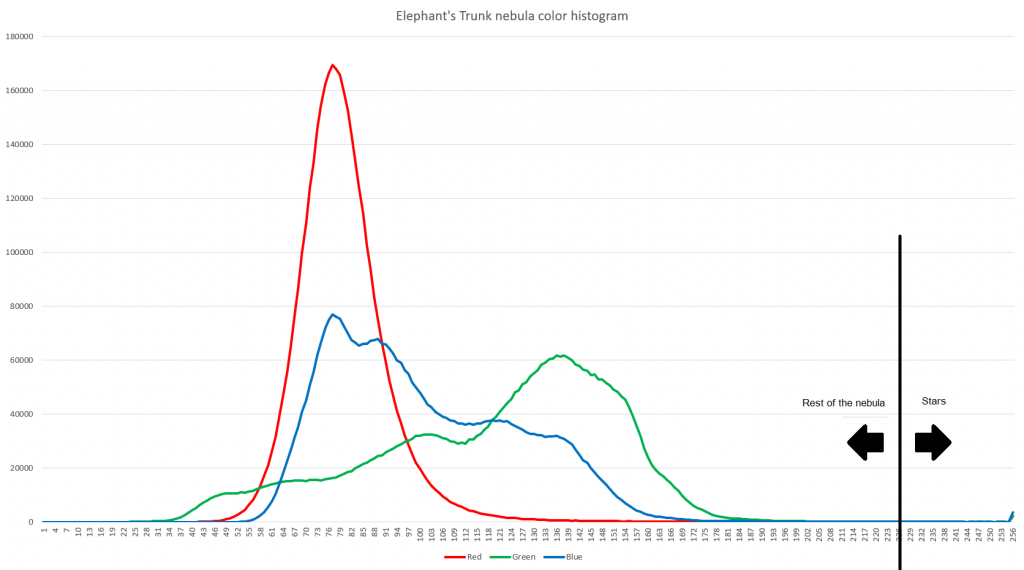
It is fairly easy to see on the histogram that most of the image is clustered around the 25 – 190 color range and there is an uptick after 253. If we draw the line anywhere between 190 and 253 we will have most of the stars on one side of the line, while the rest of the image is on the other side. The exact place to draw the line requires fine-tuning. The further left we draw the line, the more stars we will detect. However, we will also pick up more noise. If we draw the line too far to the right, we will miss a lot of dim stars, but our signal-to-noise ratio will be high.
Step 2: Star detection
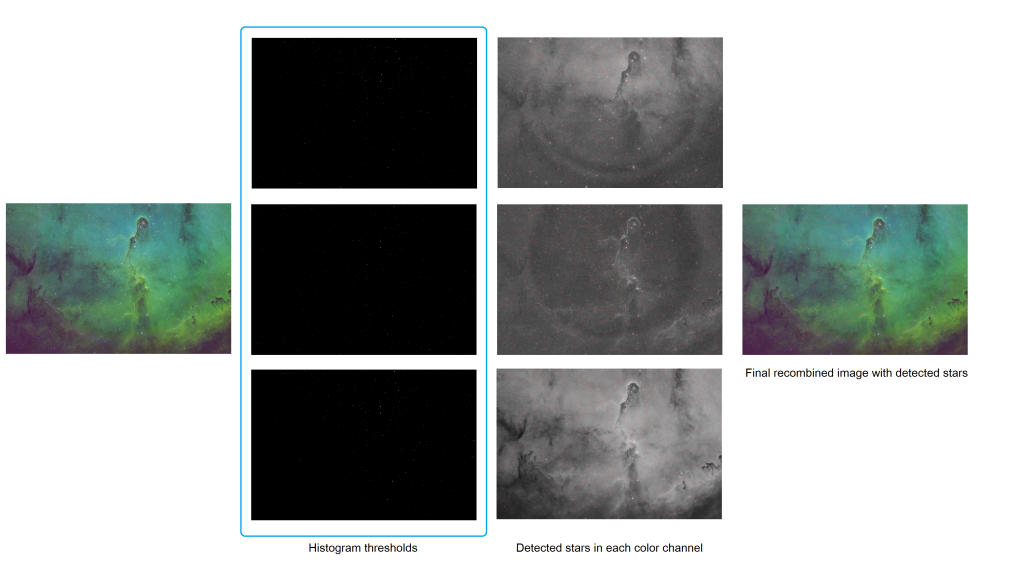
Once the plate-solver decides on the star threshold, it will apply it to the image to find stars. I suspect, most plate solvers convert a color image to gray-scale by extracting luminosity and processing it once. In my plate-solver, I decided to process each color channel as an independent gray-scale image and then take stars that were detected in the same position across all channels. This technique improves detection quality because bright spots in individual channels are ignored.
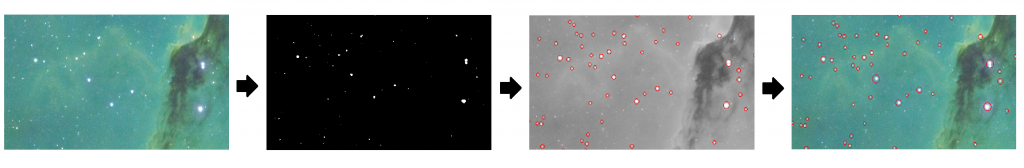
If we zoom in on the section of the image we can see the process in action a little better.
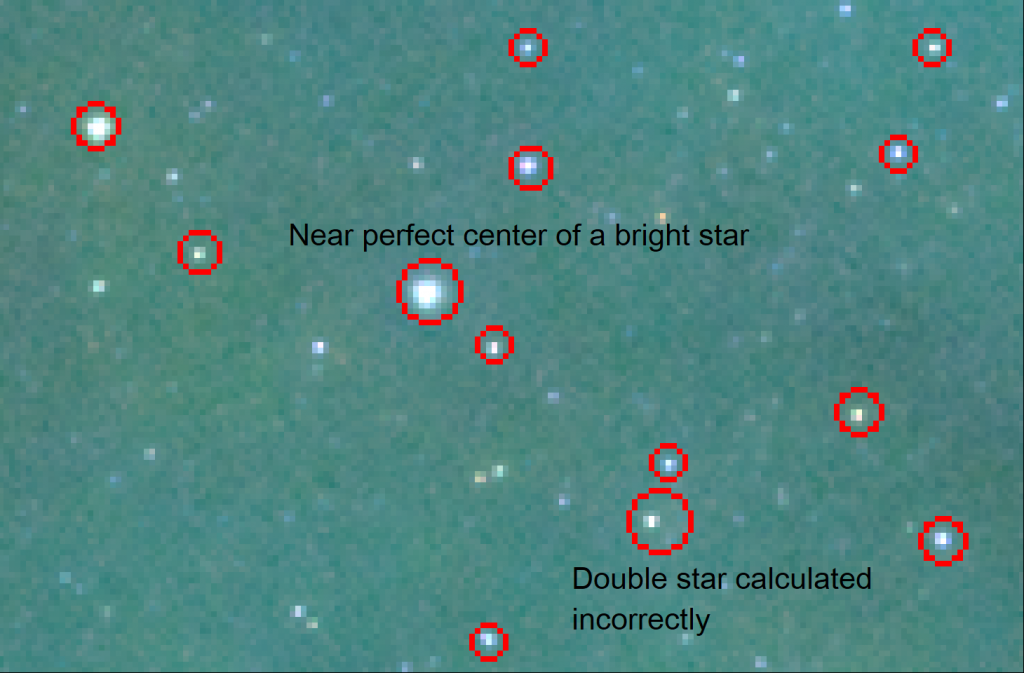
One of the problems plate-solvers face in this step is the calculation of the star center. Again, humans can visualize the center of the circle pretty easily, but computers don’t see patterns. They see individual pixels. To calculate the center of the star, plate solvers use the Center of Gravity algorithm. It works for the following reasons:
- Stars are eccentic and have a center of gravity in the center of the circle.
- Stars are brightest in the center and get dimmer towards the edges.
The Center of gravity algorithm has flaws and won’t do a good job in the following cases:
- Double-stars can get mashed together because algorithm can’t tell where one star ends and another begins.
- Center of small and dim stars will be heavily influenced by background image brightness and will be skewed.
Step 3: Star quads of the reference image
Astrophotographers take pictures with a variety of cameras and telescopes. As such they cover the same objects in the sky at variable degrees of magnification and rotation relative to the image sensor. Plate-solver must recognize the sky regardless of the scale and camera rotation angle. Moreover, plate-solver must calculate both scale and rotation angle in order to figure out precise coordinates of the center of the image.
Plate-solvers use combinations of 4 stars to form a collection of star quads from the image. During later phases of plate solving, each quad of the picture is matched to each quad from the star catalog. How do you match quads that are created at different scales and rotation angles? You normalize them.
The build a collection of quads from the reference image, the plate-solver goes through every star and finds 3 closest stars on the image. Then for every quad, it calculates the “hash code” – 6 numbers that represent distances between stars (1 – 2, 1 – 3, 1 – 4, 2 – 3, 2 – 4, and 3 – 4) divided by the longest distance among them, in pixels. This operation normalizes the star quad to the range from 0 to 1. It also calculates the average coordinates among 4 stars in the quad. These average coordinates will later be used to calculate scale and rotation angle.
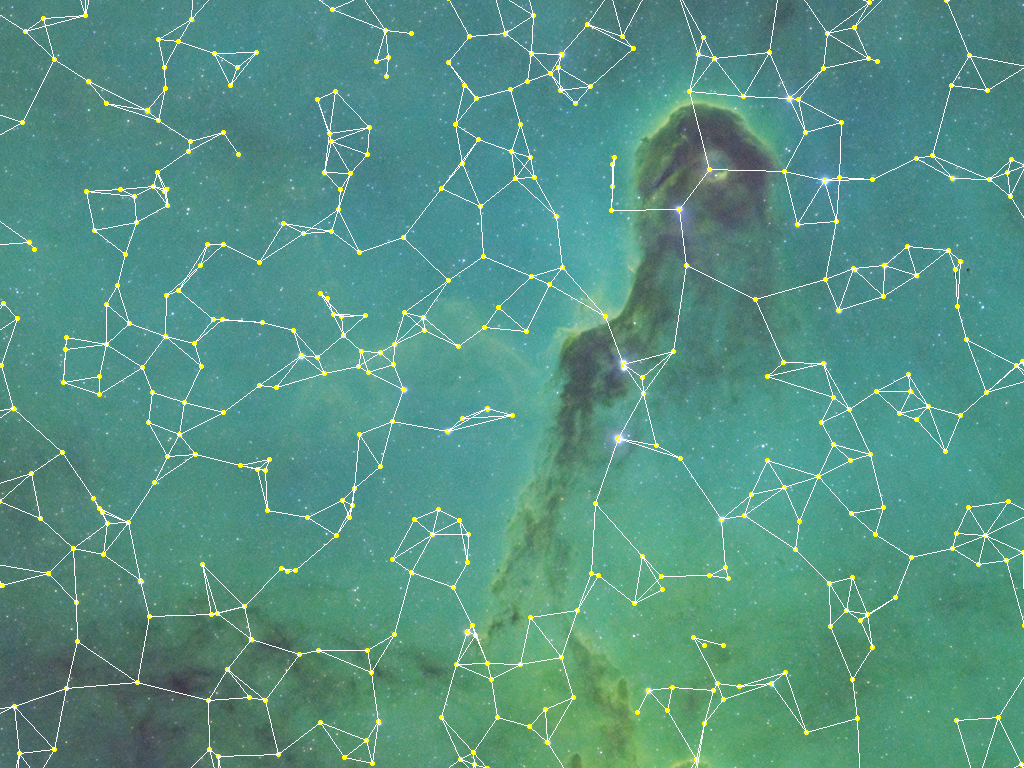
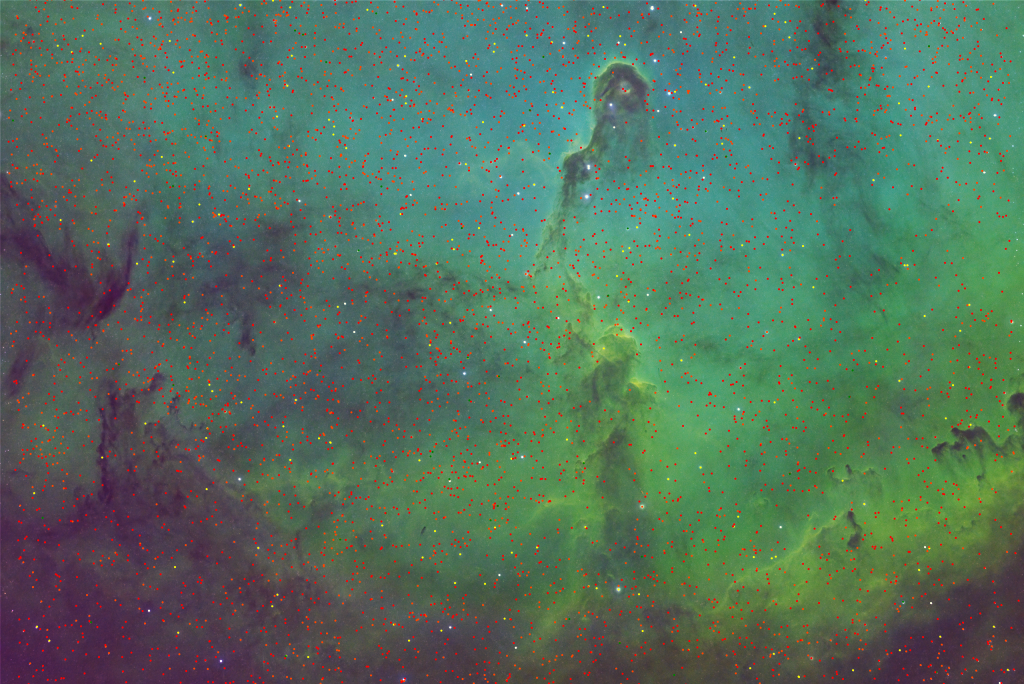
The same star can be part of multiple quads, and that’s OK. Also, not all the stars on the image will be included in quads. Some may be missing due to the low signal-to-noise ratio when detecting stars. Some may be excluded if stars are too close to each other. A few sample quads from the image of the Elephant’s Trunk nebula are depicted below. This is not a complete set.
| X coordinate, pixels | Y coordinate, pixels | Largest Distance, pixels | First normalized distance | Second normalized distance | Third normalized distance | Forth normalized distance | Fifth normalized distance |
|---|---|---|---|---|---|---|---|
| 429.5135 | 297.9123 | 93.0482 | 0.971103458 | 0.541585683 | 0.504578809 | 0.478478556 | 0.058131226 |
| 983.4961 | 1283.3288 | 74.4317 | 0.794692519 | 0.636636938 | 0.520571722 | 0.468397828 | 0.365016442 |
| 682.5731 | 725.1145 | 57.8917 | 0.908194078 | 0.519112014 | 0.497206454 | 0.491335209 | 0.312518029 |
| 275.0098 | 1142.25 | 177.862 | 0.938934476 | 0.505157518 | 0.494855241 | 0.449178425 | 0.17959982 |
| 528.2151 | 1609.6074 | 119.7565 | 0.829619808 | 0.826824692 | 0.82584552 | 0.685649305 | 0.322313057 |
Distances between stars are calculated using the Pythagorean theorem. Distances are sorted in descending order in the quad (or ascending, doesn’t matter, just pick one and stick to it).
Step 4: Search the star catalog and build star quads
All the magic happens during this step of the plate-solving process. The result (or the output) of this step is a collection of pairs of star quads that match. One of the quads in the pair will come from the image being plate-solved. The other quad will come from the reference database or stars.
Using initial coordinates in the sky and information about the telescope and the camera plate solver calculates the field of view. Astronomy.tools website has a calculator that does the same exact math.
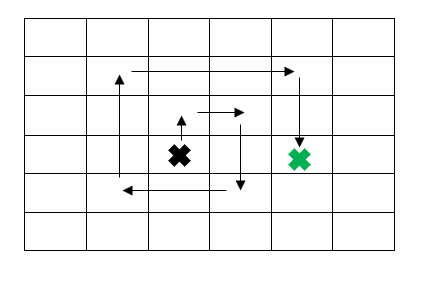
Obviously to calculate the field of view of the camera one needs to multiply PixelResolution by the width and separately by the height of the reference camera image. The entire celestial sphere is divided into sections the size of the field of view. Starting with the initial coordinates of right ascension and declination given to the plate solver, it begins a spiral search of the sky.
On every step of the search, the plate-solver program reads the stars from the star catalog that are within the field of view. These stars obviously do not have flat X and Y coordinates, they only have right ascension and declination. To obtain X and Y coordinates, these stars are projected onto the plane with the center (0, 0) going through the optical axis of the field of view. The formula for conversion is available on the Wikipedia page for the Astronomical coordinate system.
double sinOpticalAxisDeclination = Math.Sin(opticalAxisDeclinationRadians);
double cosOpticalAxisDeclination = Math.Cos(opticalAxisDeclinationRadians);

double sinStarDeclination = Math.Sin(starDeclinationRadians);
double cosStarDeclination = Math.Cos(starDeclinationRadians);

double raDelta = starRightAscentionRadians - opticalAxisRightAscentionRadians;
double sinDeltaRightAscention = Math.Sin(raDelta);
double cosDeltaRightAscention = Math.Cos(raDelta);

double deltaValue = (cosOpticalAxisDeclination * cosStarDeclination * cosDeltaRightAscention
  + sinOpticalAxisDeclination * sinStarDeclination) / (3600 * 180 / Math.PI);

double projectedStarX = -cosStarDeclination * sinDeltaRightAscention / deltaValue;
double projectedStarY = -(sinOpticalAxisDeclination * cosStarDeclination * cosDeltaRightAscention - cosOpticalAxisDeclination * sinStarDeclination) / deltaValue;
Similar to step #3, plate-solver creates a collection of star quads using a collection of flat stars. The important trick here is to create quads not only using closest stars, but also those with up to N-th degree separation. This is necessary to do because the star catalog contains all the stars in the field of view, while our star detection on the picture probably skipped a large portion of dim stars. If we do not create “gaps” we will not be able to match any quads.
Step 5: Match star quads
On every step of the spiral search, it compares the star quads of the original image with the star quads of the star database in the given field of view. This operation is O(N^2) cyclomatic complexity. Quads are considered to match if five of their normalized distances are within the tolerance interval from each other. Other parameters of the star quads are irrelevant at this phase.
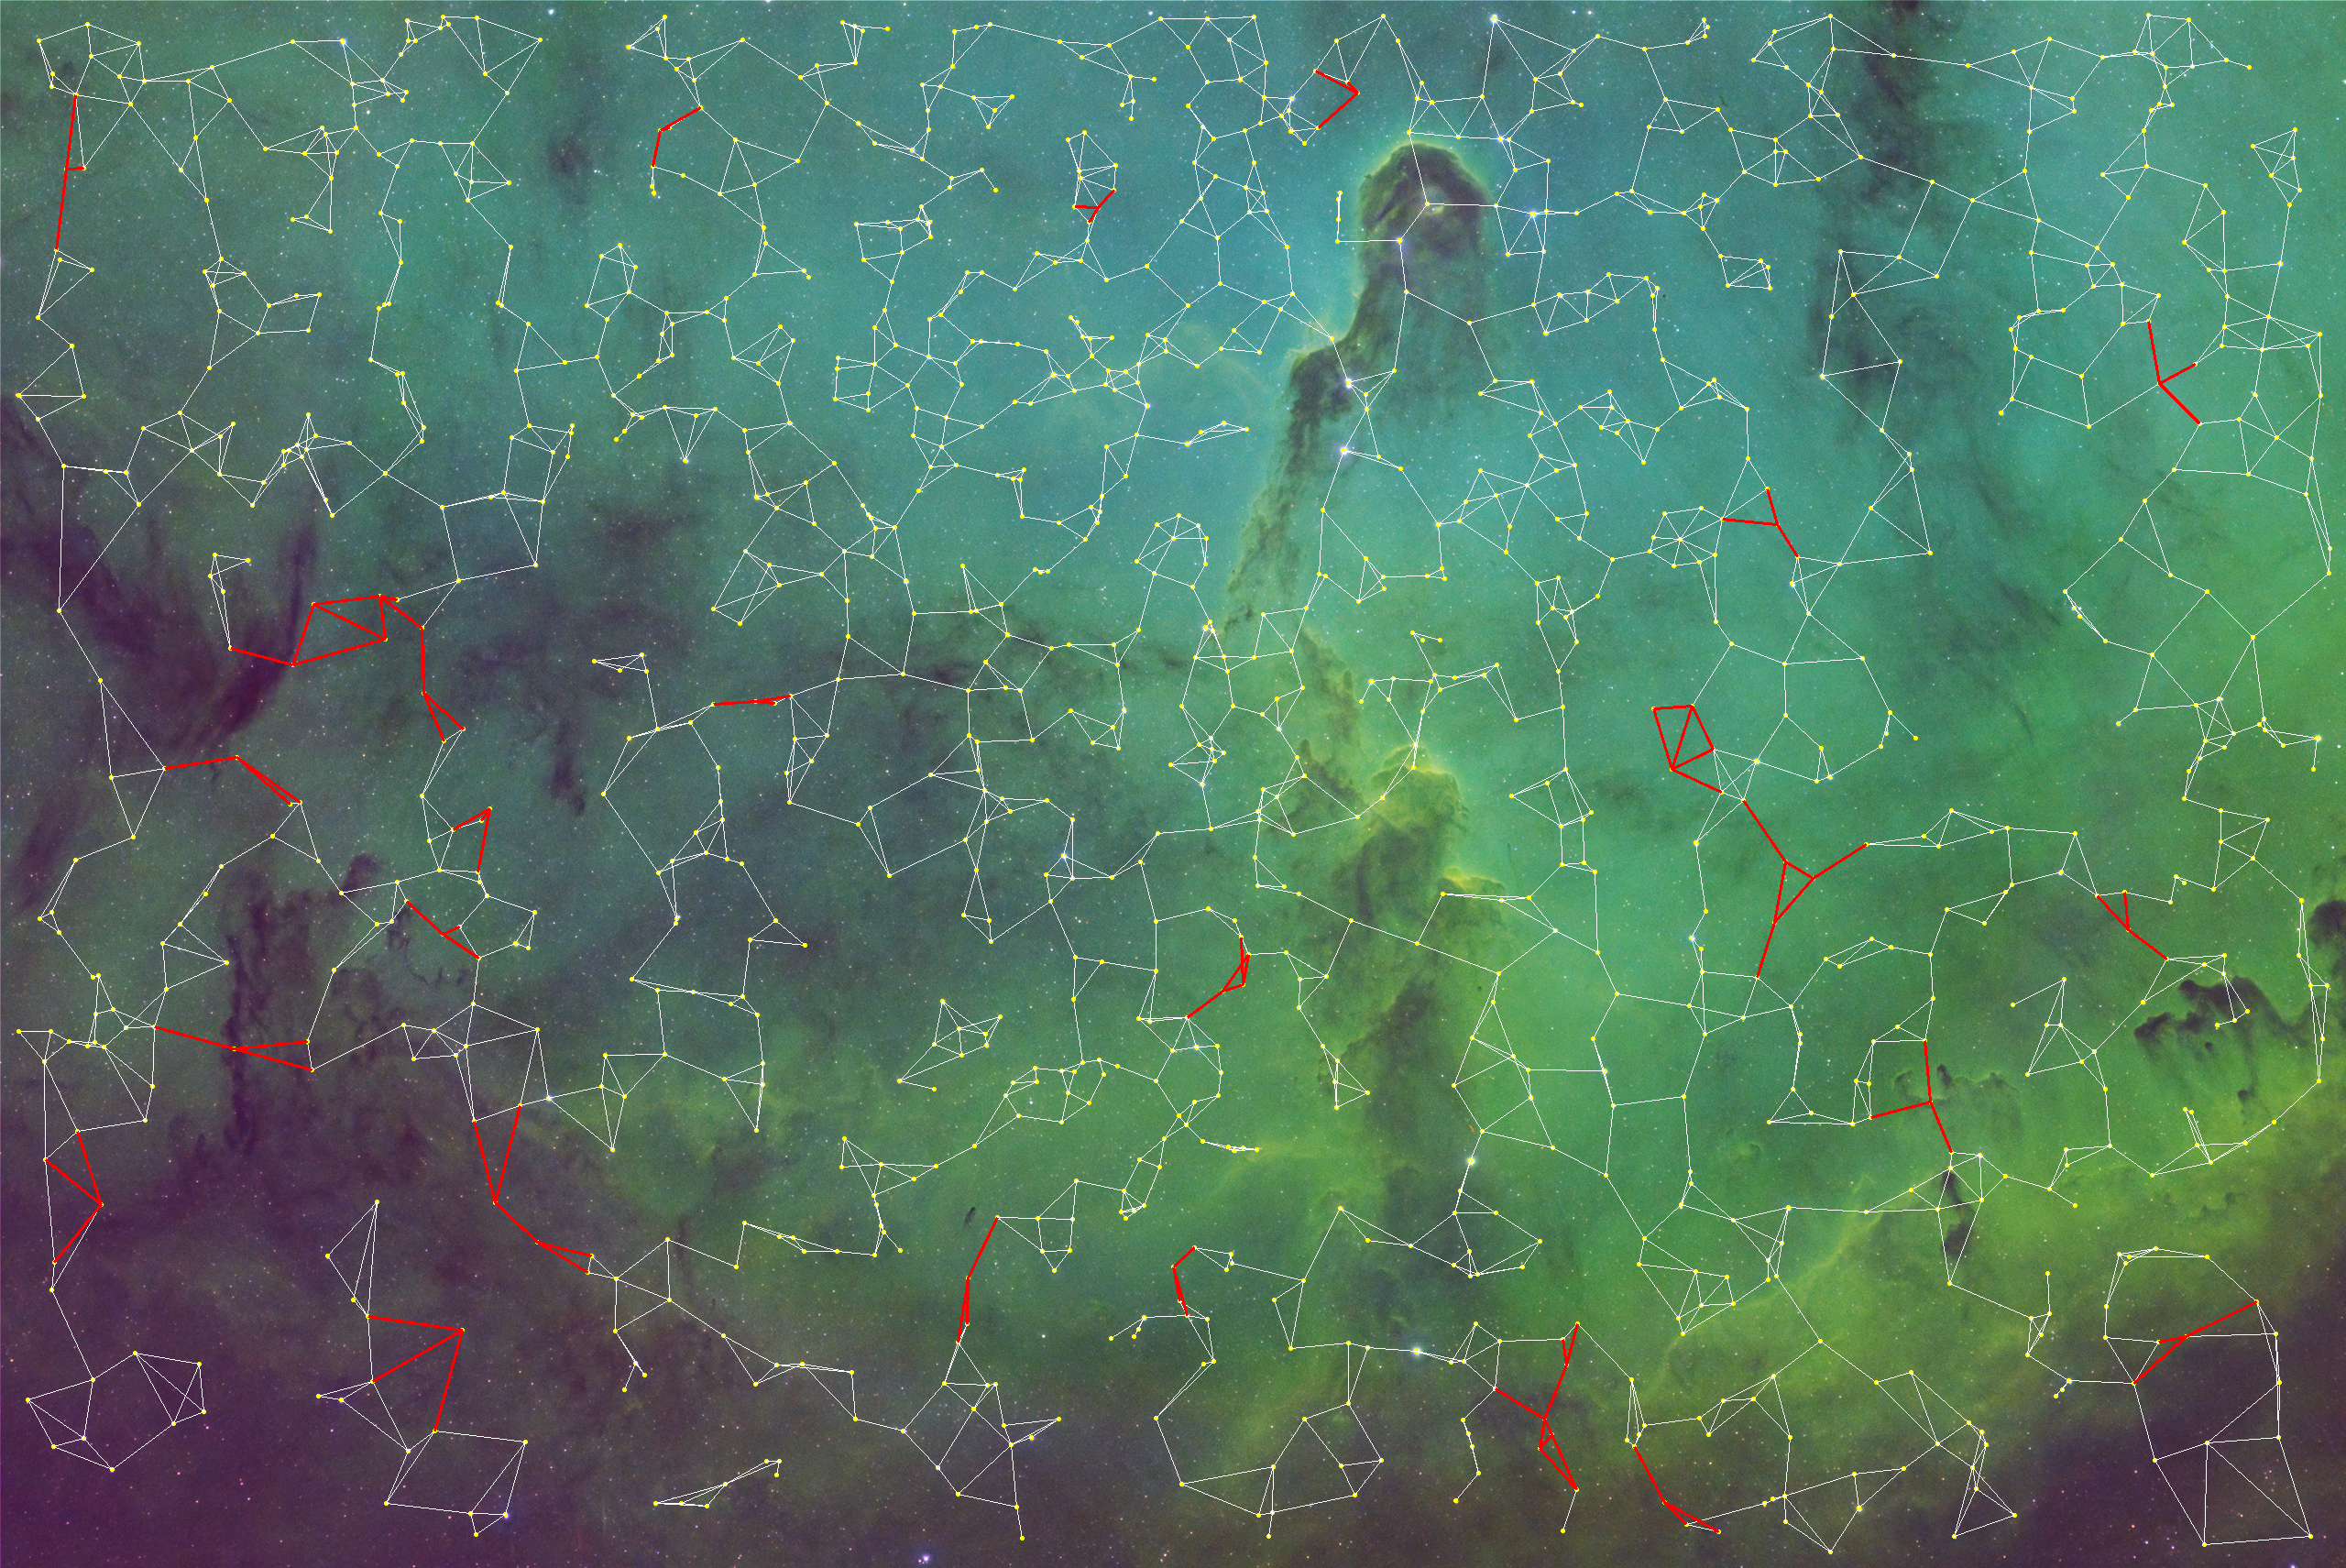
Here’s an example of two matching star quads:
| Image star quad | Database star quad | Difference | |
|---|---|---|---|
| First normalized distance | 0.61896944520747843 | 0.61987700436560234 | -0.00090755915812391 |
| Second normalized distance | 0.55775333830273033 | 0.55884949726218647 | -0.00109615895945614 |
| Third normalized distance | 0.48979834252501553 | 0.48884465178429182 | 0.00095369074072371 |
| Fourth normalized distance | 0.47681557137210878 | 0.47598962346263274 | 0.00082594790947604 |
| Fifth normalized distance | 0.13132193567363912 | 0.13299759845994066 | -0.00167566278630154 |
As such, if the plate-solver tolerance interval is 0.002 these two quads would match. Picking the right interval requires experimentation with a large number of images.
A minimum of 3 quads must match in order to calculate the coordinate system. If only 2 quads match we can only calculate the scale difference, but not the coordinate axis and angle of rotation. The more quads match the higher accuracy of the coordinate system calculation we will have.

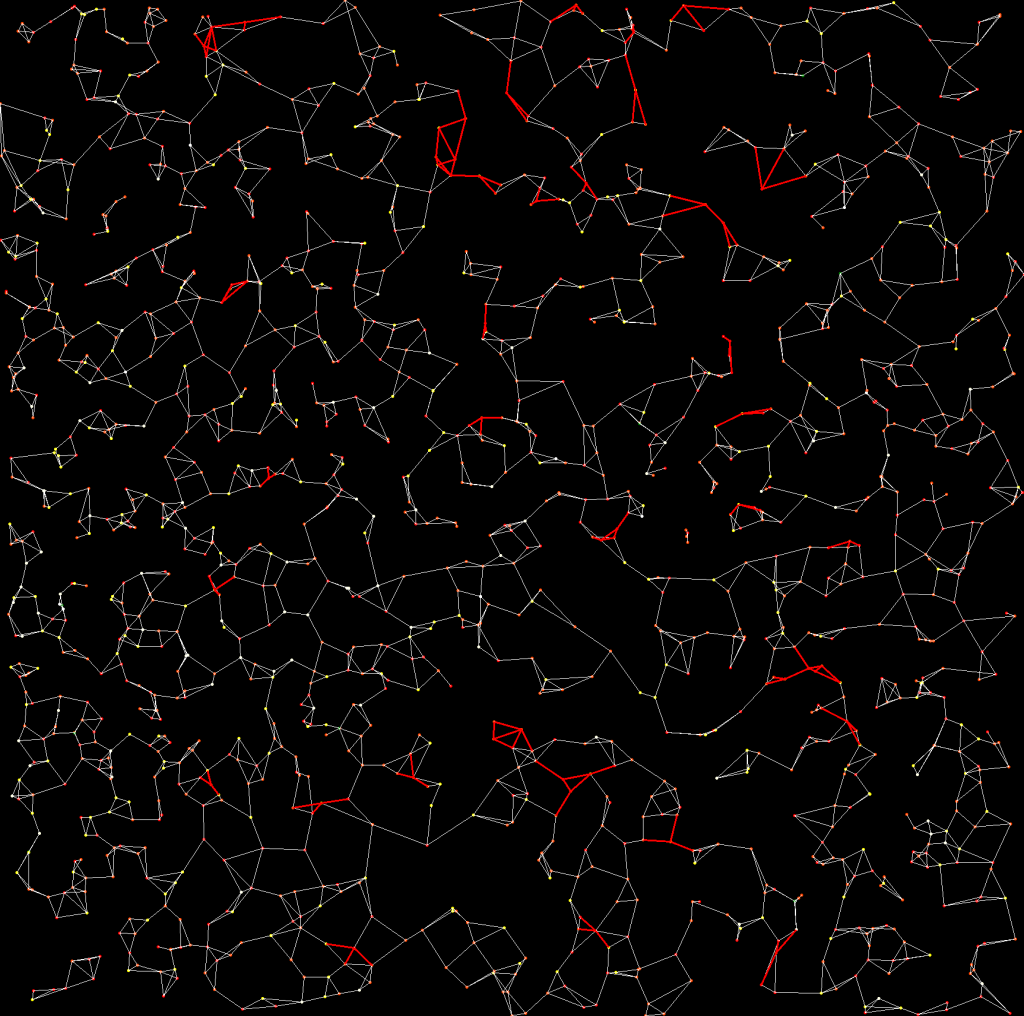
Just for fun, try figuring out which quads were matched on the pictures above and what is the angle of camera rotation relative to the reference database.
Step 6: Calculate projection coordinate system
This step of plate solving is necessary to be able to calculate coordinates of the center of the camera image in an equatorial system. This calculation has two steps:
- Convert center coordinates of the camera image (image width / 2, image hight / 2) into flat coordinates on the projected plane of the reference star database.
- Knowing projected coordinates, calculate equatorial coordinates using transformation inverse to the one in step 4.
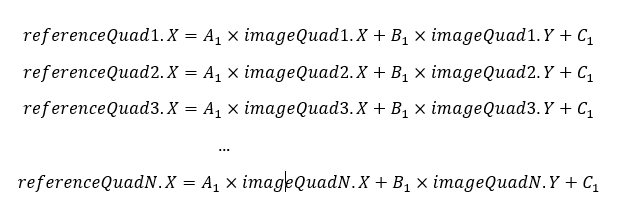
Obviously, the plate solver needs to be able to project points between the two coordinate systems. The way to do this is to re-write our matching star quads in a set of linear equations and solve them for 3 variables. Math tells us that it is sufficient to have 3 equations to solve for 3 variables – that’s why we need at least 3 star quads to match. If we have more than 3 star quads matching, then our system of linear equations becomes overdetermined.
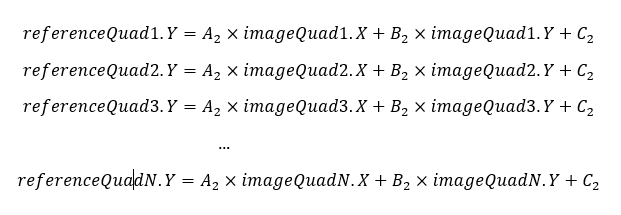
Solving these two sets of linear equations would allow the plate solver to create a projection equation from the camera coordinate system into reference star catalog coordinate system, accounting for scale and rotation. Since the application isn’t dealing with the ideal world, more than likely different equations in each set would solve for slightly different values A1, B1, and C1 or A2, B2, and C2. Least square fit with givens rotations to the rescue!
The best explanation of the method I found from Kartik Tiwari. In simple terms, a plate solver applies givens rotations over and over again until the bottom left portion of the matrix turns to 0. Each iteration strives to reduce the sum of squares of distances between all points. It uses squares rather than values to account for distances both greater and less than zero.
The solution to Elephant’s Trunk nebula picture discussed in the post is the following:
- starDatabaseX = 0.0304 * cameraX + 2.0093 * cameraY – 1757.9956
- starDatabaseY = 2.0085 * cameraX – 0.0305 * cameraY – 2544.7080
Punching the center of the image coordinates and running these equations, then running a transformation from projected to equatorial coordinates, the plate solver obtains the following coordinates of the center of the image:
- Right ascention = 21h 34m 13.8s
- Declination = +57° 21′ 39.1″
The job of a traditional plate solver is complete. These coordinates are synchronized with the equatorial mount and the imaging session can begin.
Bonus functionality
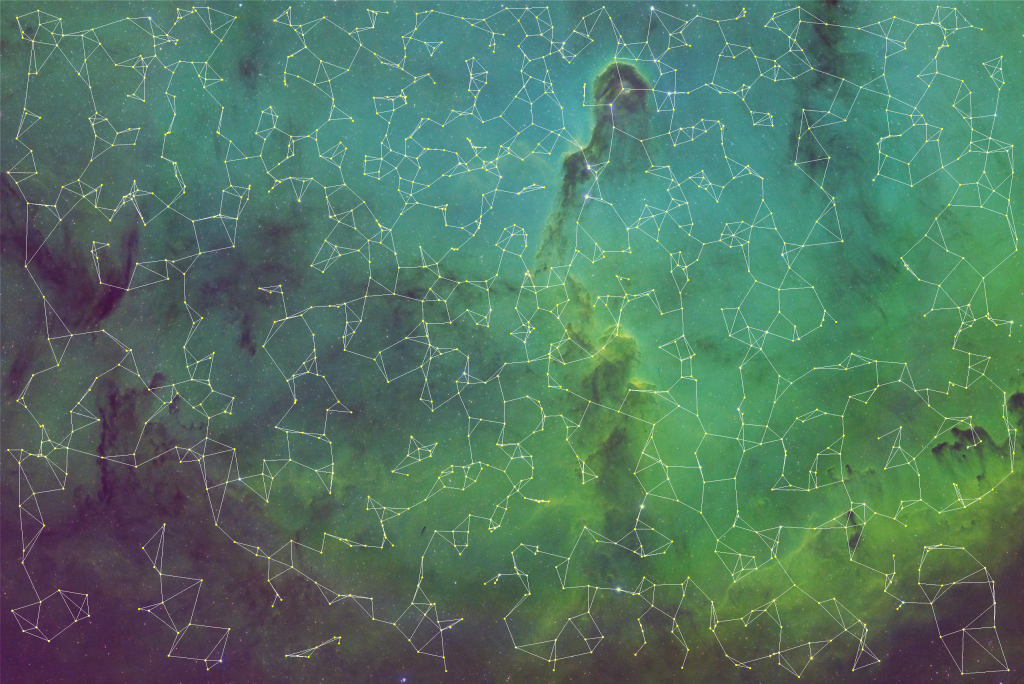
Why bother writing your own plate solver if it does only as much as an existing software and nothing more? My point exactly. Once you have the coordinate system, star catalog, center of the image, and additional internal state calculated, you can start doing cool things.
For example, you can add all the stars from the star database into the image that failed to be recognized by the plate solver or captured by the camera. Of course, this piece requires more work because the software must account for star magnitude, measured color, and point-spread function. However, as a prototype, why not just show where stars should be?